China Top 10 Wind Power Energy Manufacturers
China’s wind power energy industry has become a major force in the global renewable market. Its manufacturers supply turbines for coastal offshore farms, western desert projects, and distributed installations near industrial parks. This guide introduces ten leading Chinese companies and explains why they matter.
The selection considers turbine capacity, operating records, technology development, certification, export activity, and after-sales service. It also examines practical details, including nacelle design, blade length, gearbox choices, grid compatibility, and performance in low-wind regions. A turbine that performs well on an open coastline may not suit a mountainous inland site. Site conditions matter greatly.
The ranking is not absolute. Market data changes, public disclosures vary, and some project information remains difficult to compare. That is worth acknowledging. A large order book does not always prove stronger long-term reliability. Field maintenance, spare-part access, and technician response can influence project value just as much as rated capacity. Real experience matters.
This overview draws on company disclosures, industry reports, certification records, and publicly available project information. It aims to help readers compare manufacturers with greater confidence. The discussion covers established names such as Goldwind, Envision Energy, Mingyang Smart Energy, Windey Energy, and other important Chinese suppliers. Each company has different strengths, from offshore engineering to large onshore turbines and digital monitoring systems. The goal is not to promote one brand, but to clarify how these manufacturers compete and where their solutions may fit best.
China’s Wind Power Manufacturing Landscape
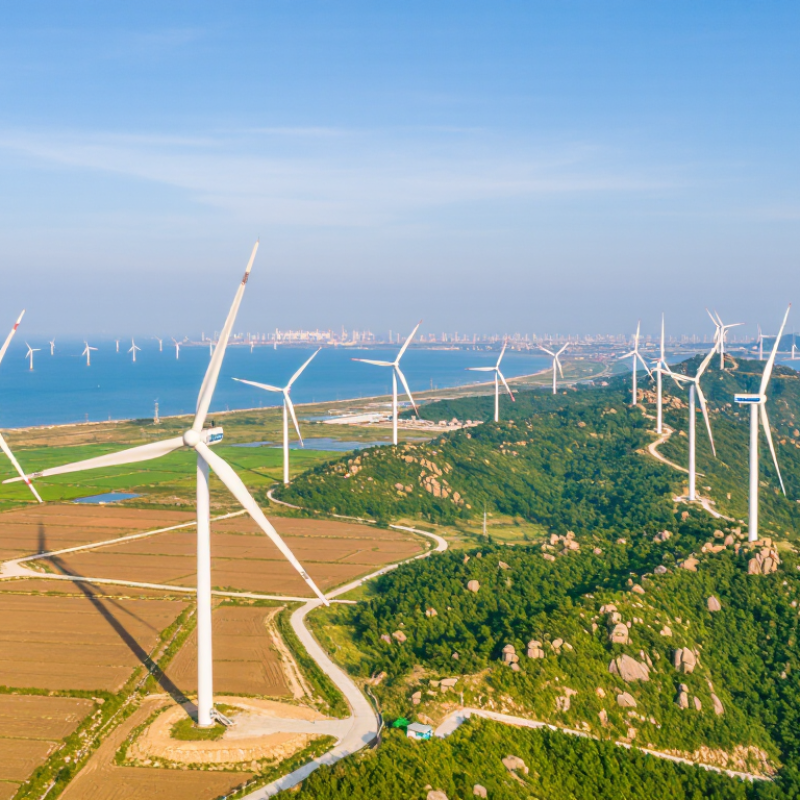
China’s wind power manufacturing landscape is now defined by scale, speed, and intense supply-chain coordination. The Global Wind Energy Council’s Global Wind Report 2024 recorded 75.9 GW of new wind capacity in China during 2023. Its cumulative capacity reached about 441 GW, covering both land-based and offshore projects. China also represented roughly two-thirds of global new installations that year.
The country’s top ten manufacturers compete across turbines, blades, generators, towers, control systems, and maintenance services. Their advantage is not only factory size. Dense industrial clusters reduce transport time, while large domestic projects support repeated engineering improvements. IRENA’s Renewable Capacity Statistics 2024 confirms China’s leading position in global wind capacity. Still, rankings can mislead. Shipment volume does not always prove long-term reliability, local service quality, or stable performance in harsh coastal conditions. That deserves closer testing.
Tips: Compare nacelle efficiency, availability rates, warranty terms, and spare-part access. Check independent project data, not only supplier brochures. For offshore equipment, inspect corrosion protection and grid-connection experience. A lower purchase price may create higher maintenance costs. The calculation is imperfect, but necessary.
Profiles of China’s Top 10 Wind Power Manufacturers
China Top 10 Wind Power Energy Manufacturers
China’s leading wind power manufacturers reflect the country’s rapid shift toward large-scale renewable energy. Their profiles show different strengths, from turbine engineering to blade production and project services. Several operate extensive testing centers, where engineers examine vibration, temperature, and load performance before commercial delivery.
The largest manufacturers usually offer turbines for both coastal and inland conditions. Offshore models often use reinforced structures, corrosion-resistant materials, and remote monitoring systems. Inland suppliers focus on high-altitude sites, weak-grid areas, and regions with irregular wind patterns. Some companies also produce generators, control systems, towers, and replacement components. This broader supply chain can reduce project delays.
Service capability matters as much as factory capacity. Leading firms provide installation guidance, predictive maintenance, and digital inspection tools across multiple provinces and overseas markets. Their field teams may inspect a gearbox at dawn, with wind moving dust across a remote access road. Practical experience is visible there.
Still, published rankings deserve careful reading. Production volume does not always prove stronger reliability. Some performance figures use different testing periods or project conditions, making direct comparisons imperfect. Certification records, warranty terms, grid experience, and long-term operating data offer better evidence. Smaller manufacturers may also perform well in specialized projects, but receive less public attention. That gap deserves more investigation.
China Top 10 Wind Power Energy Manufacturers - Profiles of China’s Top 10 Wind Power Manufacturers
| Rank |
Manufacturer Profile |
Core Market |
Onshore Turbine Portfolio |
Offshore Capability |
Drive-Train Technologies |
International Activity |
Corporate Status |
| 1 |
Manufacturer Profile 01 |
Onshore & offshore |
Multi-megawatt platforms |
Established offshore portfolio |
Direct-drive and geared |
Asia, Europe, Africa and the Americas |
Publicly listed group |
| 2 |
Manufacturer Profile 02 |
Onshore & offshore |
Large-scale and low-wind-speed models |
Commercial offshore supply |
Permanent-magnet direct drive |
Projects in multiple overseas markets |
Privately controlled enterprise |
| 3 |
Manufacturer Profile 03 |
Onshore & offshore |
High-capacity onshore platforms |
Large offshore platforms |
Direct-drive systems |
Export-oriented manufacturing and services |
Publicly listed group |
| 4 |
Manufacturer Profile 04 |
Primarily onshore |
Low-wind-speed and high-altitude models |
Selective offshore participation |
Geared and direct-drive options |
Limited but expanding overseas presence |
Privately controlled enterprise |
| 5 |
Manufacturer Profile 05 |
Onshore & offshore |
Utility-scale turbine platforms |
Offshore engineering capability |
Direct-drive and semi-direct drive |
International EPC and equipment projects |
State-owned industrial group |
| 6 |
Manufacturer Profile 06 |
Primarily onshore |
Medium- and high-capacity models |
Developing offshore range |
Geared and permanent-magnet systems |
Selected overseas projects |
Publicly listed group |
| 7 |
Manufacturer Profile 07 |
Onshore & offshore |
Large onshore platforms |
Offshore prototype and project experience |
Direct-drive systems |
Mainly domestic market |
State-owned enterprise |
| 8 |
Manufacturer Profile 08 |
Primarily onshore |
Utility-scale and distributed-wind models |
Limited offshore activity |
Geared systems |
Primarily domestic deployment |
State-owned enterprise |
| 9 |
Manufacturer Profile 09 |
Onshore & offshore |
Medium- to high-capacity platforms |
Commercial offshore experience |
Direct-drive and geared |
Selected international markets |
State-owned enterprise |
| 10 |
Manufacturer Profile 10 |
Primarily onshore |
Standard and high-capacity platforms |
Developing offshore capability |
Geared and direct-drive options |
Domestic focus with selected exports |
Publicly listed group |
Note: The profiles are anonymized. Rankings and product classifications may vary by reporting year, installed capacity, order volume, or market-share methodology.
Key Products, Technologies, and Production Capabilities
China Top 10 Wind Power Energy Manufacturers
China’s leading wind power manufacturers supply complete turbine systems, generators, blades, towers, and control equipment. Their product portfolios cover onshore, offshore, and high-altitude projects. Modern turbines commonly use permanent-magnet generators, variable-speed operation, and intelligent pitch control. These technologies improve energy capture during changing wind conditions.
Blade factories increasingly use carbon-fiber reinforcement, automated molding, and ultrasonic inspection. Some blades now exceed 100 meters, creating demanding transport and installation requirements. Tower production often combines thick steel plates, robotic welding, and corrosion-resistant coatings. Offshore equipment requires stronger foundations, sealed electrical systems, and protection against saltwater exposure. Tough environments matter.
Production capability is not only about factory size. It includes component testing, digital quality tracking, spare-parts planning, and service teams near operating projects. Manufacturers may use vibration sensors, remote monitoring, and predictive maintenance software to identify gearbox or bearing problems early. Independent certification and long-term field records also support credibility.
The industry is not flawless. Delivery schedules can change when ports, grid connections, or raw materials create delays. Published capacity figures may also differ from actual annual output. Buyers should examine verified test data, warranty terms, failure rates, and local maintenance resources. A large production line looks impressive, but reliable performance depends on disciplined engineering after installation.
Market Share, Innovation, and Global Expansion Comparison
China’s top ten wind power manufacturers compete through scale, engineering depth, and overseas delivery. Their combined influence is strongest in China’s utility-scale market, where annual installations remain among the world’s largest. Exact market-share rankings change by year, turbine segment, and measurement method. Shipment volume is not the same as profitable global presence.
Innovation is moving beyond larger rotors. Several leading producers now develop turbines above 10 megawatts for deep-water projects, while improving low-wind models for inland regions. Digital twins, predictive maintenance, and recyclable blade research are becoming practical tools. A technician can inspect vibration data before a gearbox failure stops production. That detail matters.
Global expansion reveals sharper differences. Some manufacturers export complete turbines, towers, and control systems through coastal logistics hubs. Others build local assembly lines, train regional engineers, and adapt equipment to grid codes, weather, and service conditions. Projects in Europe, Asia, Latin America, and the Middle East show growing reach, but overseas market share remains uneven. Financing, certification, local content rules, and long-term maintenance can decide success more than factory capacity.
The comparison is not perfectly clean. Public data may combine domestic orders with international shipments, and some contracts remain undisclosed. Cost leadership also brings questions about durability, component sourcing, and after-sales response. A lower purchase price can become expensive when spare parts travel thousands of kilometers. Manufacturers with stronger testing records and service networks may therefore create greater lifetime value, even when their initial market share appears smaller.