China’s clean-energy landscape is too large for one obvious winner. A project may produce enormous power, yet still create ecological, social, or transmission challenges. This article asks a practical question: What makes the best green energy project in China?
The answer depends on the standards we choose. Generation capacity matters, but so do land use, reliability, local employment, storage, and environmental protection. A vast solar base in Qinghai can offer strong sunlight and open terrain. However, distant demand requires long transmission lines. Zhangbei’s wind and storage facilities show another path, linking renewable electricity with flexible grid support. Offshore wind projects near Jiangsu demonstrate how coastal resources can serve industrial regions. Each example has measurable strengths and unresolved weaknesses.
My first assumption was simple: the largest project must be the best. That view is incomplete. A green energy project should be judged through its entire operating life, not its opening ceremony. Construction materials, battery recycling, water use, biodiversity, and community benefits deserve careful review. Official data from China’s National Energy Administration, grid operators, and project assessments can improve credibility, but statistics may not reveal every local experience. Field observations also matter, such as turbine maintenance near fishing villages or dust control around desert solar panels.
The following discussion compares leading Chinese projects through these practical criteria. It recognizes impressive progress without ignoring trade-offs. The final choice may remain debatable. That is useful. A reliable answer should explain its limits, not hide them.
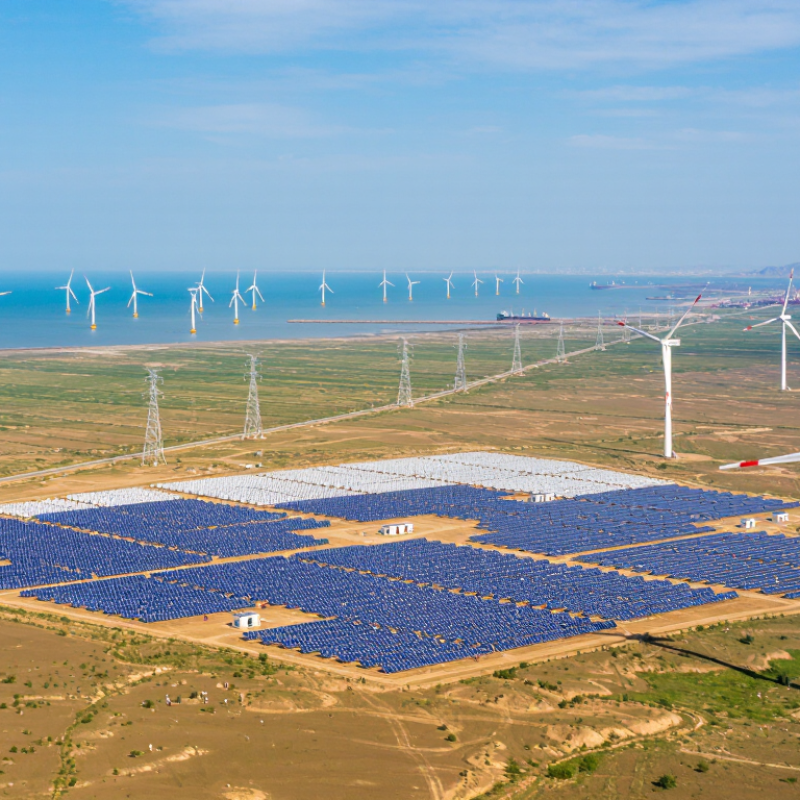
The best green energy project cannot be judged by capacity alone. A massive wind or solar base may produce impressive numbers, yet weak grid access can reduce real output. A stronger candidate combines high annual generation, stable transmission, and carefully planned storage. Capacity shows potential. Delivered electricity shows performance.
Levelized cost of electricity, or LCOE, should include construction, financing, maintenance, replacement batteries, and grid connection. A low headline cost can become misleading when curtailment or storage expenses are excluded. CO₂ reduction also needs lifecycle accounting. Manufacturing, transport, construction, and recycling all matter. Renewable power still has an environmental footprint.
Tips: Compare delivered electricity, not installed capacity. Check five-year operating data when available. Ask whether the project displaces coal generation or simply adds supply. I would also test seasonal results, because winter output and summer demand rarely align perfectly.
A practical evaluation should use audited generation records, transparent cost assumptions, and verified emissions methods. Projects near strong transmission corridors often perform better than remote sites with larger capacity. Hybrid designs may offer steadier output, but batteries can raise LCOE and require careful replacement planning. My assessment remains imperfect because public data is not always consistent. That uncertainty deserves attention.
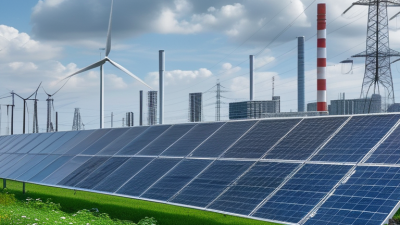
China’s 2024 renewable baseline is remarkable. Public national energy statistics show more than 1.2 TW of combined wind and solar capacity. This scale changes how energy projects should be judged. The strongest project may not be the largest field. It may be an integrated system linking turbines, solar panels, storage, and a responsive power grid.
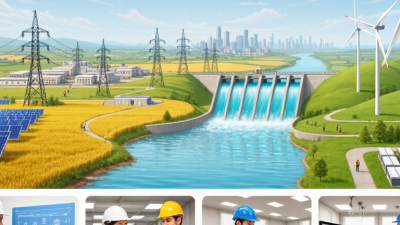
Picture a northwest energy base at midday. Rows of panels produce intense power, while tall turbines continue working through changing winds. Batteries can shift some electricity into the evening. High-voltage transmission then carries power toward factories and cities. These details matter because renewable capacity alone does not guarantee reliable supply. Grid flexibility, forecasting, and maintenance deserve equal attention.
The baseline is impressive, but it is not a complete success measure. Some projects still face weak local demand, transmission limits, or ecological pressure. Land use also needs careful review, especially near farms and fragile habitats. I would assess each project through four questions: How much clean electricity does it deliver? How consistently does it operate? Who benefits locally? What environmental costs remain? The answer may be less convenient than expected. A smaller project with storage and strong community planning could outperform a giant facility on paper. Progress is real, but the measurement needs more honesty.
What makes China’s strongest green-energy project worth studying? Its 22.5 GW installed capacity provides an exceptional view of modern hydropower. This capacity describes maximum generation under suitable operating conditions. Designed output is 88.2 TWh annually. At that level, the implied capacity factor is about 45 percent. The calculation is significant because it connects engineering potential with practical electricity production.
That scale matters beyond a single power station. Water flowing through multiple turbines can support regional grids and reduce dependence on fossil-fuel generation. Operators can adjust generation as demand changes, which strengthens grid flexibility. However, output is not constant. Droughts, sediment movement, seasonal rainfall, and reservoir restrictions can reduce actual production. Numbers alone cannot describe performance.
A responsible evaluation must examine environmental and social conditions alongside capacity. Reservoir management can influence river habitats, shipping routes, and downstream water availability. Sediment control requires continuous monitoring. Communities also need transparent compensation and long-term planning. These issues do not erase the project’s clean-energy contribution, but they complicate simple claims of perfection. The weaker point is predictability. Actual yearly production may differ from the designed 88.2 TWh, especially during unusual weather. Independent audits, public operating data, and updated hydrological studies would make its green-energy credentials more reliable.
What Is the Best Green Energy Project in China?
Operational Performance: 111.8 TWh of Hydropower Generated in 2020
China’s strongest green energy projects should be judged by performance, reliability, and environmental responsibility. One major hydropower system generated 111.8 TWh of electricity in 2020. That equals 111.8 billion kilowatt-hours, showing remarkable operational scale. It also demonstrates how water resources can support stable, low-carbon power generation.
However, output alone does not prove that a project is the best. Hydropower depends on rainfall, reservoir levels, equipment maintenance, and seasonal demand. River ecosystems and nearby communities also require careful protection. A professional assessment should examine generation records, safety controls, sediment management, and long-term ecological monitoring. The 2020 figure is impressive, but one year cannot reveal every weakness. Drought conditions may expose risks later.
Tips: Check annual output, not promotional claims. Compare several years of data. Review local water impacts. Ask whether emergency plans are tested. Small details matter.
Reliable projects need more than turbines and reservoirs. They need transparent reporting, skilled operators, and continuous technical upgrades. In practice, the best project is not simply the largest producer. It is the one that maintains strong output while reducing harm and responding honestly to changing conditions.
| Performance Dimension | Recorded Data | Operational Significance |
|---|---|---|
| Annual hydropower generation | 111.8 TWh in 2020 | Set a record for annual output by a single hydropower station and demonstrated high renewable-energy productivity. |
| Installed generating capacity | 22.5 GW | Provides substantial low-carbon electricity capacity for the national power system. |
| Average equivalent full-load utilization | Approximately 4,969 hours in 2020 | Calculated from annual generation divided by installed capacity, indicating strong utilization of the generating assets. |
| Annual average utilization rate | Approximately 56.7% | Reflects the ratio of equivalent full-load hours to the 8,760 hours in a year. |
| Generating units | 34 units in total | A multi-unit configuration supports operational flexibility, maintenance scheduling, and grid stability. |
| Main generating units | 32 units rated at 700 MW each | Large standardized units improve scale efficiency and simplify long-term operational management. |
| Reservoir storage capacity | Approximately 39.3 billion m³ | Supports seasonal water regulation, electricity generation, and downstream flow management. |
| Dam height | 185 m | Enables a significant hydraulic head for efficient conversion of river flow into electricity. |
| Dam crest length | Approximately 2,309 m | Represents the scale of the integrated water-control and power-generation infrastructure. |
| Electricity equivalent | 111.8 billion kWh | The 2020 output supplied a large volume of electricity without direct combustion of fossil fuels during generation. |
| Renewable-energy classification | Conventional hydropower | Uses naturally replenished river flows as the primary energy source and produces electricity with very low direct operational emissions. |
Note: The equivalent full-load utilization and utilization rate are calculated from the reported 2020 generation and installed capacity. Physical specifications are rounded published figures for the representative large-scale hydropower project.
China’s strongest green energy project is not a single wind farm. It is an integrated renewable corridor linking desert solar, inland wind, storage, and distant demand centers.
This scale makes grid integration the real test. Power must move hundreds of kilometers.
Ultra-high-voltage transmission reduces losses across long distances and connects resource-rich western regions with coastal industry. The International Energy Agency’s Renewables 2024 report expects China to provide almost 60% of global renewable capacity additions through 2030.
Yet installed capacity does not equal dependable electricity. Daily output still follows sunlight and weather.
In 2024, China’s new energy storage capacity reached about 73.8 million kilowatts, according to the National Energy Administration. Much of it provides only a few hours of shifting. That limitation matters during calm evenings and winter peaks.
Regional impact is uneven. Western provinces gain investment, construction work, and new transmission infrastructure. Coastal users gain cleaner electricity, but they may not receive lower bills immediately.
Curtailment has improved, though local congestion remains possible. The China Electricity Council continues to emphasize flexible generation, demand response, and stronger interprovincial trading.
A practical design would combine batteries, pumped storage, flexible hydropower, and time-based industrial demand. I would not call the model fully dispatchable yet. Its scale is impressive, but its reliability still depends on coordination, forecasting, and market reform.