Global energy buyers are reassessing renewable energy sources as electricity demand, climate risks, and fuel-price volatility reshape procurement decisions. The International Energy Agency’s Renewables 2024 report projects nearly 5,500 gigawatts of new renewable capacity between 2024 and 2030. That expansion would make renewables the dominant source of new global power generation. The trend is strong. It is not risk-free.
IRENA’s Renewable Capacity Statistics 2025 recorded 585 gigawatts of renewable capacity additions in 2024. Total installed capacity reached approximately 4,448 gigawatts worldwide. Solar power led the growth, while wind and hydropower remained essential for system balance. These figures help buyers understand scale, but capacity alone can mislead. A desert solar project may produce cheap daytime electricity, while a coastal wind farm can deliver stronger winter output. Grid access, storage, land, water use, local permitting, and equipment durability matter just as much.
This guide examines ten leading renewable energy sources for global buyers, including solar, wind, hydropower, geothermal, biomass, and marine energy. Each option has a different operating profile. Each carries trade-offs. Buyers should compare lifetime costs, capacity factors, emissions, maintenance needs, supply-chain exposure, and contract terms. The levelized cost of electricity is useful, but it cannot capture every project risk. A low bid may hide expensive transmission upgrades or unstable generation. That weakness deserves attention. Reliable decisions require independent technical studies, transparent assumptions, and region-specific data from sources such as the IEA, IRENA, and national grid operators.
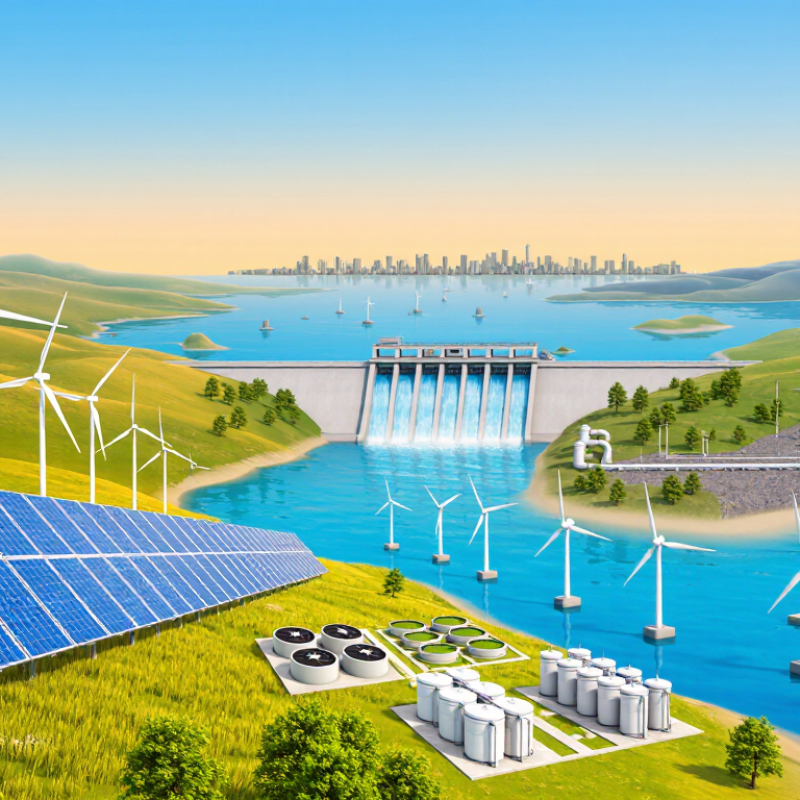
Renewable energy comes from naturally replenished flows, such as sunlight, wind, moving water, geothermal heat, and sustainable bioenergy. These sources can produce electricity, heating, or cleaner industrial power. Unlike fossil fuels, they release little or no operational carbon dioxide.
The difference matters.
For global buyers, renewable energy supports lower emissions, more stable long-term planning, and stronger supply-chain credibility. The International Renewable Energy Agency reported 473 gigawatts of renewable capacity additions in 2023, representing 86% of total new power capacity worldwide. The International Energy Agency expects renewable capacity to expand by roughly 5,500 gigawatts from 2024 to 2030. These figures show a structural shift, not a short-lived trend.
However, renewable energy is not impact-free. Solar projects need land and minerals. Wind projects require careful wildlife and community assessments. Hydropower can alter river ecosystems. Intermittency also remains a practical concern. Buyers should examine grid reliability, storage access, project age, lifecycle emissions, and certificate quality before signing contracts. A low headline price may hide transmission costs or weak verification. I have seen procurement teams focus heavily on tariffs and overlook hourly matching. That approach needs reconsideration. The best source depends on local weather, grid conditions, regulations, and operating demand, not popularity alone. For many buyers, a balanced portfolio of solar, wind, hydro, geothermal, and bioenergy offers greater resilience than one technology.
A practical comparison of major renewable energy sources for international procurement, project planning, and long-term energy strategy.
| Rank | Renewable Energy Source | Primary Energy Conversion | Typical Global Capacity Factor | Indicative Lifecycle Emissions | Resource Availability | Reliability Profile | Best-Fit Applications for Global Buyers | Main Procurement Considerations |
|---|---|---|---|---|---|---|---|---|
| 1 | Solar Photovoltaic | Sunlight converted directly into electricity | 10%–30%, depending on solar resource, orientation, and tracking | Approximately 20–50 g CO₂e/kWh | Very widely available; strongest in high-irradiance regions | Variable and daylight-dependent; output can be forecast accurately | Rooftops, utility-scale projects, commercial facilities, remote power, and distributed generation | Land or roof area, grid connection, module durability, recycling provisions, and battery or grid balancing needs |
| 2 | Onshore Wind | Wind movement converted into electricity by turbines | 25%–50%, depending on wind conditions and site quality | Approximately 8–15 g CO₂e/kWh | Strong in coastal areas, plains, mountain passes, and open rural regions | Variable but often complementary to solar generation | Large-scale electricity supply, industrial power, and long-term contracted clean energy | Wind resource assessment, permitting, transmission access, land rights, noise limits, and community acceptance |
| 3 | Offshore Wind | Offshore wind movement converted into electricity | 35%–55% at favorable sites | Approximately 10–20 g CO₂e/kWh | Best for countries and regions with suitable continental shelves and strong coastal winds | Variable, with generally stronger and more consistent wind than many land sites | High-volume electricity for coastal markets, ports, desalination, and industrial clusters | Higher development and installation complexity, subsea cables, marine surveys, vessels, and port infrastructure |
| 4 | Hydropower | Flowing or falling water converted into electricity | 30%–60% for many projects; some facilities operate at higher levels | Approximately 1–30 g CO₂e/kWh, with site-specific variation | Concentrated in regions with suitable rivers, elevation changes, and water availability | Highly dispatchable when reservoir storage is available | Grid stability, baseload supply, peak power, and long-duration energy balancing | Large capital requirements, hydrology, environmental impact, resettlement risk, water competition, and long permitting periods |
| 5 | Geothermal Energy | Earth’s internal heat converted into electricity or direct heat | 70%–95% for suitable electricity projects | Approximately 20–50 g CO₂e/kWh, depending on resource and technology | Most accessible in volcanic, tectonically active, or high-temperature geological regions | Reliable and capable of continuous operation | Baseload electricity, district heating, industrial heat, greenhouses, and food processing | Exploration risk, drilling cost, geological conditions, water management, and resource sustainability |
| 6 | Concentrated Solar Power | Solar heat concentrated to produce steam and electricity | 20%–45%, depending on design and thermal storage | Approximately 20–40 g CO₂e/kWh | Best in regions with very high direct normal solar irradiation | Can provide dispatchable output when paired with thermal storage | Utility-scale generation, evening peak supply, and industrial process heat | Requires large, sunny sites; higher engineering complexity; water consumption may be significant in some designs |
| 7 | Biomass Energy | Organic matter converted into electricity, heat, or fuels | 60%–85% for facilities with dependable fuel supply | Highly variable; approximately 30–230 g CO₂e/kWh depending on feedstock and land-use impacts | Depends on sustainable agricultural residues, forestry residues, organic waste, or dedicated feedstocks | Dispatchable when fuel storage and supply chains are available | Combined heat and power, waste treatment, industrial heat, and renewable fuel production | Feedstock sustainability, transport distance, air-quality controls, land-use impacts, and supply-chain verification |
| 8 | Biogas and Biomethane | Organic waste decomposed anaerobically to produce methane-rich gas | 50%–90% for electricity generation, depending on operation | Potentially low or near-negative when methane emissions are avoided; highly dependent on feedstock and leakage control | Available where agricultural waste, wastewater sludge, food waste, or municipal organic waste is concentrated | Dispatchable and suitable for flexible generation | Waste management, industrial boilers, combined heat and power, and gas-grid or transport applications | Gas upgrading, leakage monitoring, feedstock contracts, digestate management, and sustainability certification |
| 9 | Tidal and Wave Energy | Ocean tides, currents, or waves converted into electricity | 20%–45% for early commercial and demonstration projects | Approximately 15–35 g CO₂e/kWh, subject to technology and site conditions | Limited to suitable coastlines with strong tidal ranges, currents, or wave resources | Tidal output is highly predictable; wave output is variable | Island grids, coastal communities, marine facilities, and diversified clean-energy portfolios | Technology maturity, corrosion, marine maintenance, environmental monitoring, and subsea connection costs |
| 10 | Renewable Hydrogen | Renewable electricity used in electrolysis to split water into hydrogen and oxygen | Depends on the renewable electricity source; electrolyzers are commonly sized for flexible operation | Potentially below 1–3 kg CO₂e per kg H₂ when powered by very low-carbon electricity; project-specific | Can be produced wherever renewable electricity, water, and hydrogen infrastructure are available | Energy carrier rather than a primary source; can be stored and used when needed | Steelmaking, chemicals, shipping fuels, long-duration storage, heavy transport, and industrial heat | High electricity demand, electrolyzer utilization, water treatment, storage, transport, safety, and certification of renewable origin |