China Top 10 Renewable Energy Sources Suppliers?
China’s renewable energy sources industry has moved from large factories to highly integrated supply chains. Solar modules, wind turbines, batteries, inverters, and hydro equipment now leave production lines serving projects worldwide. This scale creates opportunities, but it also makes supplier selection more demanding.
Fatih Birol, Executive Director of the International Energy Agency, stated, “The world is set to add as much renewable power in the next five years as it did in the previous 20 years.” His observation reflects the market’s speed. It also highlights a practical concern: rapid growth does not automatically guarantee dependable equipment or service.
This article introduces China’s top 10 renewable energy sources suppliers through measurable and project-focused criteria. These include manufacturing capacity, product certifications, research investment, export experience, delivery performance, warranty terms, and after-sales support. A solar panel may look impressive under bright showroom lights. Its real value appears after years of heat, dust, humidity, and grid fluctuations.
Company scale matters. Not everything.
Buyers should also examine financial stability, factory quality controls, traceable materials, and independent performance testing. Supplier rankings can simplify research, but they cannot replace technical due diligence. Some companies have stronger global brands, while others offer specialized products or flexible customization. That difference deserves attention.
The following overview aims to support informed comparison. It does not suggest that one supplier fits every project. Requirements vary by region, climate, budget, grid design, and maintenance capability. Even experienced buyers can overlook hidden costs. A careful shortlist remains essential.
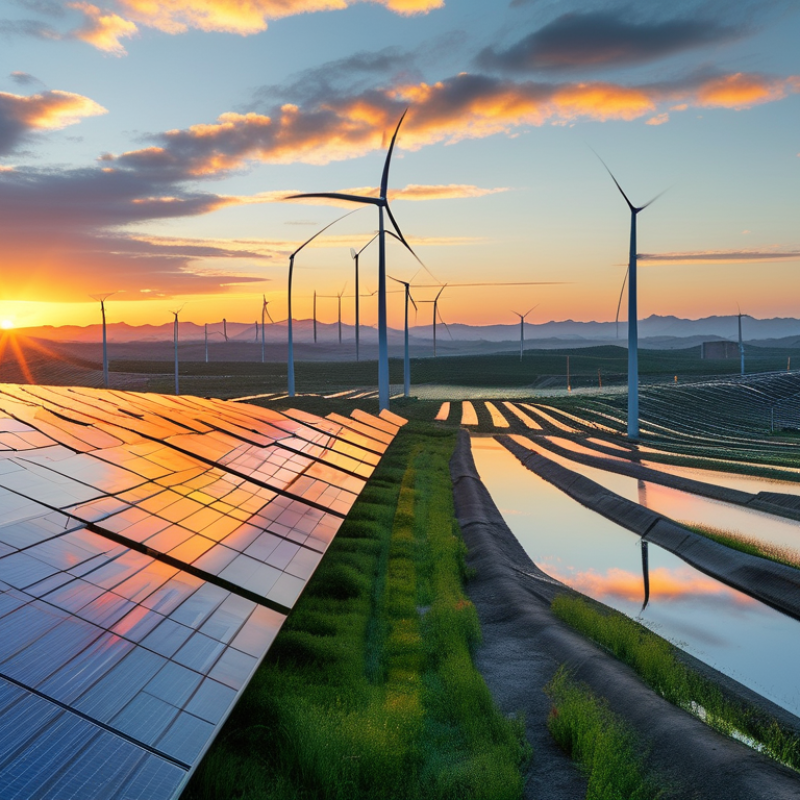
China’s Renewable Energy Market: 1,450 GW Installed Capacity by 2023
China’s renewable energy market reached about 1,450 GW of installed capacity by the end of 2023.
The National Energy Administration reported this milestone across hydropower, wind, solar, and biomass projects.
Solar capacity exceeded 600 GW
, while wind power passed 440 GW. These figures show remarkable manufacturing depth and strong project demand.
The International Renewable Energy Agency’s Renewable Capacity Statistics 2024 also identified China as the world’s largest renewable capacity market. Its 2023 additions represented a major share of global growth. For buyers comparing China’s top renewable energy suppliers, installed capacity is only one indicator. Factory audits, conversion efficiency, warranty terms, grid compliance, and delivery records matter more during a real project.
Details can expose risk.
A solar module may look competitive, yet temperature performance can reduce output in western provinces. Wind equipment needs careful review in deserts, coastal zones, and low-temperature regions. Hydropower suppliers require stronger engineering evidence than a simple product catalogue. Public procurement data and independent certification can improve confidence, although neither removes every uncertainty. Capacity numbers are impressive, but they do not automatically prove long-term reliability.
Ranking Criteria: Shipment Volume, Manufacturing Capacity, Revenue, and Certifications
China Top 10 Renewable Energy Sources Suppliers?
Ranking China’s top renewable energy suppliers requires more than checking factory size. Shipment volume shows whether a supplier can serve international demand consistently. However, shipping data may include trading activity, not only in-house production. Manufacturing capacity provides stronger evidence when supported by factory audits, equipment records, and production schedules. A large facility can still operate below its advertised output.
Revenue helps measure commercial stability, but figures may cover several business divisions. We therefore compare renewable energy revenue separately whenever reliable disclosures are available. Certifications deserve equal attention. Valid quality, safety, environmental, and product certifications indicate controlled processes, not automatic product excellence. Their issuing bodies, validity dates, and covered models must be checked carefully. Small details matter.
A practical ranking combines these four indicators instead of relying on one impressive number. Shipment volume may receive 30 percent, manufacturing capacity 30 percent, revenue 20 percent, and certifications 20 percent. The weighting can change by product category. For example, battery suppliers need stricter attention to testing and traceability. Solar component suppliers may require deeper capacity verification. Site visits, sample inspections, and customer references add valuable experience to public data. Some records remain incomplete. That weakness should be disclosed, not hidden. A supplier with moderate volume but transparent documentation may deserve a higher position than a larger, less verifiable producer.
China’s Top 10 Renewable Energy Suppliers by Technology and Market Share
China’s top ten renewable energy suppliers are best assessed by technology, shipment volume, and domestic market share. The ranking changes when exports, project ownership, or manufacturing capacity are measured separately. The International Energy Agency reports that China produces over 80% of global solar modules, cells, wafers, and polysilicon. This concentration gives leading solar suppliers strong cost advantages, but it also increases exposure to price cycles.
Solar suppliers dominate the list, followed by wind turbine manufacturers, battery producers, and power-electronics companies. China’s National Energy Administration recorded 216.9 gigawatts of new solar capacity in 2023. The Global Wind Energy Council reported approximately 75.6 gigawatts of new wind installations during the same year. These figures explain why the highest-ranked suppliers usually serve utility-scale projects. Still, shipment share is not the same as profitability.
Battery suppliers are gaining influence as storage supports solar and wind integration. The IEA estimated that China held about 80% of global battery cell manufacturing capacity in 2023. Leading suppliers compete through energy density, cycle life, safety systems, and delivery speed. Market-share rankings remain imperfect, because some manufacturers disclose shipments clearly while others combine batteries, inverters, and project revenues. Buyers should verify audited data, warranty terms, and local service capacity before trusting any “top ten” list.
Solar, Wind, Hydropower, and Battery Storage Supplier Performance Metrics
China’s top ten renewable energy suppliers should be assessed through measurable performance, not shipment claims. IRENA reported that China added about 373 gigawatts of renewable capacity in 2024, representing most of global growth. Solar suppliers therefore need strong module efficiency, degradation control, warranty depth, and delivery consistency. Wind suppliers require turbine availability, capacity factor, service response, and performance in low-wind regions. Cheap equipment is not automatically reliable.
Hydropower suppliers should disclose generation stability, project completion records, environmental monitoring, and maintenance intervals. Battery storage suppliers need closer scrutiny. The IEA’s Batteries and Secure Energy Transitions report identifies grid storage as essential for integrating variable renewable power, while China’s energy-storage market continues expanding rapidly. Useful indicators include round-trip efficiency, cycle life, response time, safety testing, and usable capacity after ten years. CNESA data also shows China’s new energy-storage installations growing sharply, although reporting standards remain uneven.
Numbers can mislead. A high capacity factor may reflect favorable geography rather than better engineering. A low bid may conceal weaker after-sales support. Procurement teams should compare independently verified data, local operating records, spare-parts access, and grid-connection experience. The ranking may change by project type. That is the uncomfortable part. A supplier leading in solar modules may perform poorly in offshore wind or battery integration. Metrics need context, and published figures deserve careful checking.
China Top 10 Renewable Energy Sources Suppliers? – Solar, Wind, Hydropower, and Battery Storage Supplier Performance Metrics
Data note: This anonymized benchmark avoids company and brand identifiers. Technical ranges reflect commonly published specifications for China’s renewable-energy supply chain; actual performance varies by model, project design, operating conditions, and certification requirements.
Export Reach, R&D Investment, and 2030 Renewable Energy Growth Outlook
China’s top ten renewable energy suppliers are increasingly judged beyond factory scale. Export reach now depends on certification, local service, shipping reliability, and long-term maintenance. Solar modules, wind turbines, batteries, and grid equipment move through different approval systems. A strong supplier should provide test records, production data, and traceable quality controls. Field experience matters. A delayed replacement part can stop an entire project.
R&D investment is reshaping competition before 2030. Leading manufacturers are improving battery safety, turbine efficiency, power forecasting, and recycling processes. Some allocate substantial resources to laboratories, pilot lines, and software teams. However, spending alone proves little. Buyers should compare patent activity, independent testing, product failure rates, and upgrade support. Marketing claims can sound impressive. Real performance is harder to hide over five years.
Export growth will likely continue as countries expand solar, wind, storage, and hybrid power systems. China’s suppliers may gain from mature supply chains and competitive manufacturing costs. Yet trade rules, local-content requirements, currency movements, and port disruption remain serious risks. The 2030 outlook is promising, but not automatic. Suppliers must adapt designs for deserts, tropical humidity, weak grids, and cold climates. A ranking based only on shipment volume can mislead. The better question is whether a supplier can deliver reliable energy after installation.
China Renewable Energy Suppliers: Market Scale, Export Reach, R&D Context and 2030 Outlook
China’s installed renewable power capacity by source, end-2023 versus end-2024
China’s renewable capacity expanded sharply in 2024, led by solar and wind. By the end of 2024, combined wind and solar capacity reached approximately 1,408 GW, exceeding China’s official 2030 target of at least 1,200 GW six years ahead of schedule. The figures represent national sector capacity rather than individual companies. Export reach and supplier R&D strength are reflected by China’s large manufacturing base, but comparable supplier-level R&D data are not included in this national-capacity chart.
Sources: China National Energy Administration, 2023–2024 renewable power capacity releases; State Council Information Office, China’s 2030 wind and solar capacity target.